Each site in detail: countries, devices, sources and top pages
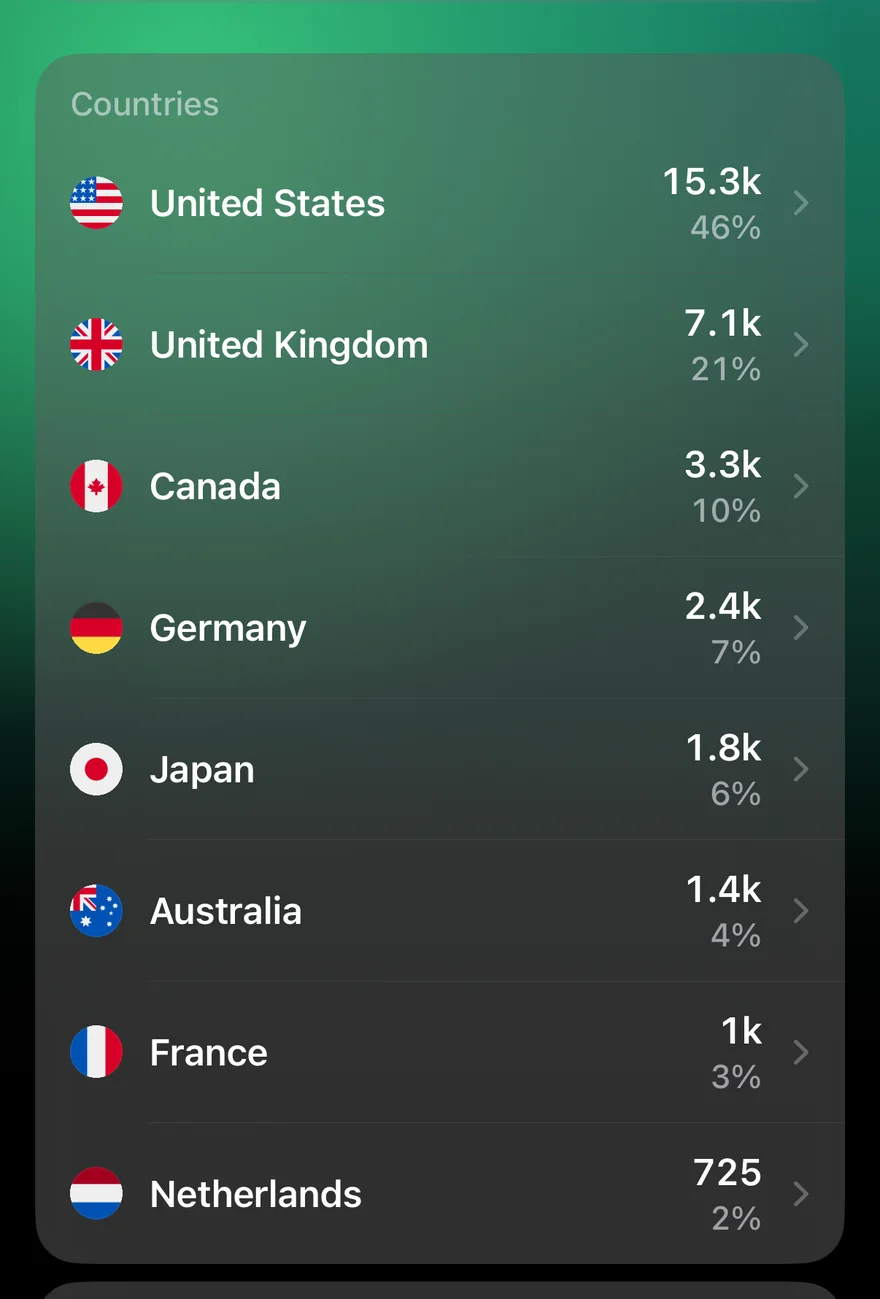
The dashboard is for a quick look across everything. Tap a site and you get the detail, for whichever time frame you've chosen.
Users
- What changed (iPhone, since 1.2): the sources and pages that grew or fell most against the period before. More on that card.
- Countries: every country by users, with flags and each one's share. In the apps, tap a country for its regions and cities.
- Devices: mobile, desktop and tablet, with a bar for each.
- Sources: where sessions came from (Google, direct, social networks, AI assistants), each with the site's own icon.
Pages
Your most-viewed pages, by views and users. GA Bridge shows the page's title first and its path underneath, and drops your site's name from titles ("Belgrade, Serbia" rather than "Belgrade, Serbia · My Travel Blog"), since every row would repeat it.
Since iPhone 1.2 (36) and Android 1.2 (33), each page also shows how long people spent on it on average ("3m 24s each"), and Longest read ranks the list by that instead of by views, so you can tell the pages that hold people from the ones they leave. Tap any page to open it on your site; long-press to copy or share its link.
The headline, too
Above the breakdowns are the site's users for the time frame, the comparison with the previous period, who's on right now and the typical-day chart. Change the time frame from the calendar button in the corner and everything on the page follows.