Spot an unusual day from the list of sites
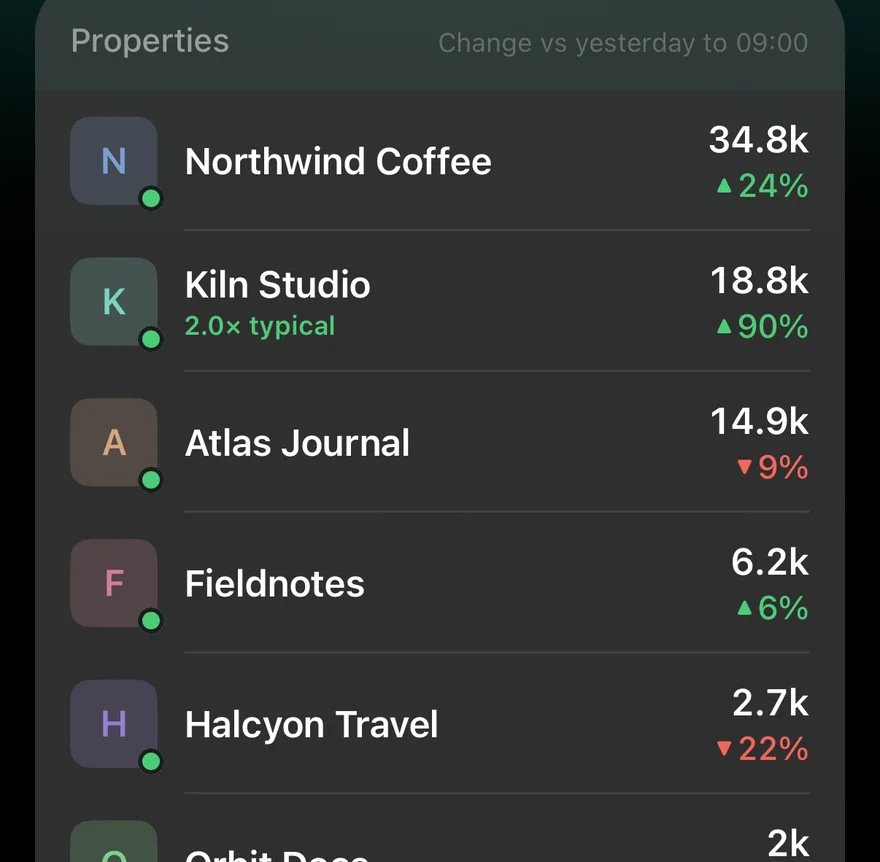
The question behind opening an analytics app is usually "is anything odd?". Since iPhone 1.2 (36) and Android 1.2 (33), the dashboard answers it without tapping into each site.
What you see
On Today, a site that's well ahead of its typical day to the same hour gets a line under its name in green, such as "2.4× typical". One well behind gets it in red: "40% of typical". Every other row stays as it was: the name, the users and the change against yesterday.
When it appears
Only when the gap is big, half again above a typical day or under 60% of it, and only on enough visitors to mean something. A site with a dozen visitors a day doesn't get flagged for having twenty.
A typical day is the average of the last 28 days, hour by hour, so it's a better yardstick than yesterday alone: a Monday against a Sunday says little. Likely bots are left out of both sides.
To see why a site is up or down, open it: the What changed card at the top of its Users tab names the sources and pages that moved.